The Org Chart Is a Lie
The org chart records who reports to whom, not how work actually flows. Here's what Organizational Network Analysis (ONA) reveals about your company — and why it matters more in the age of AI.

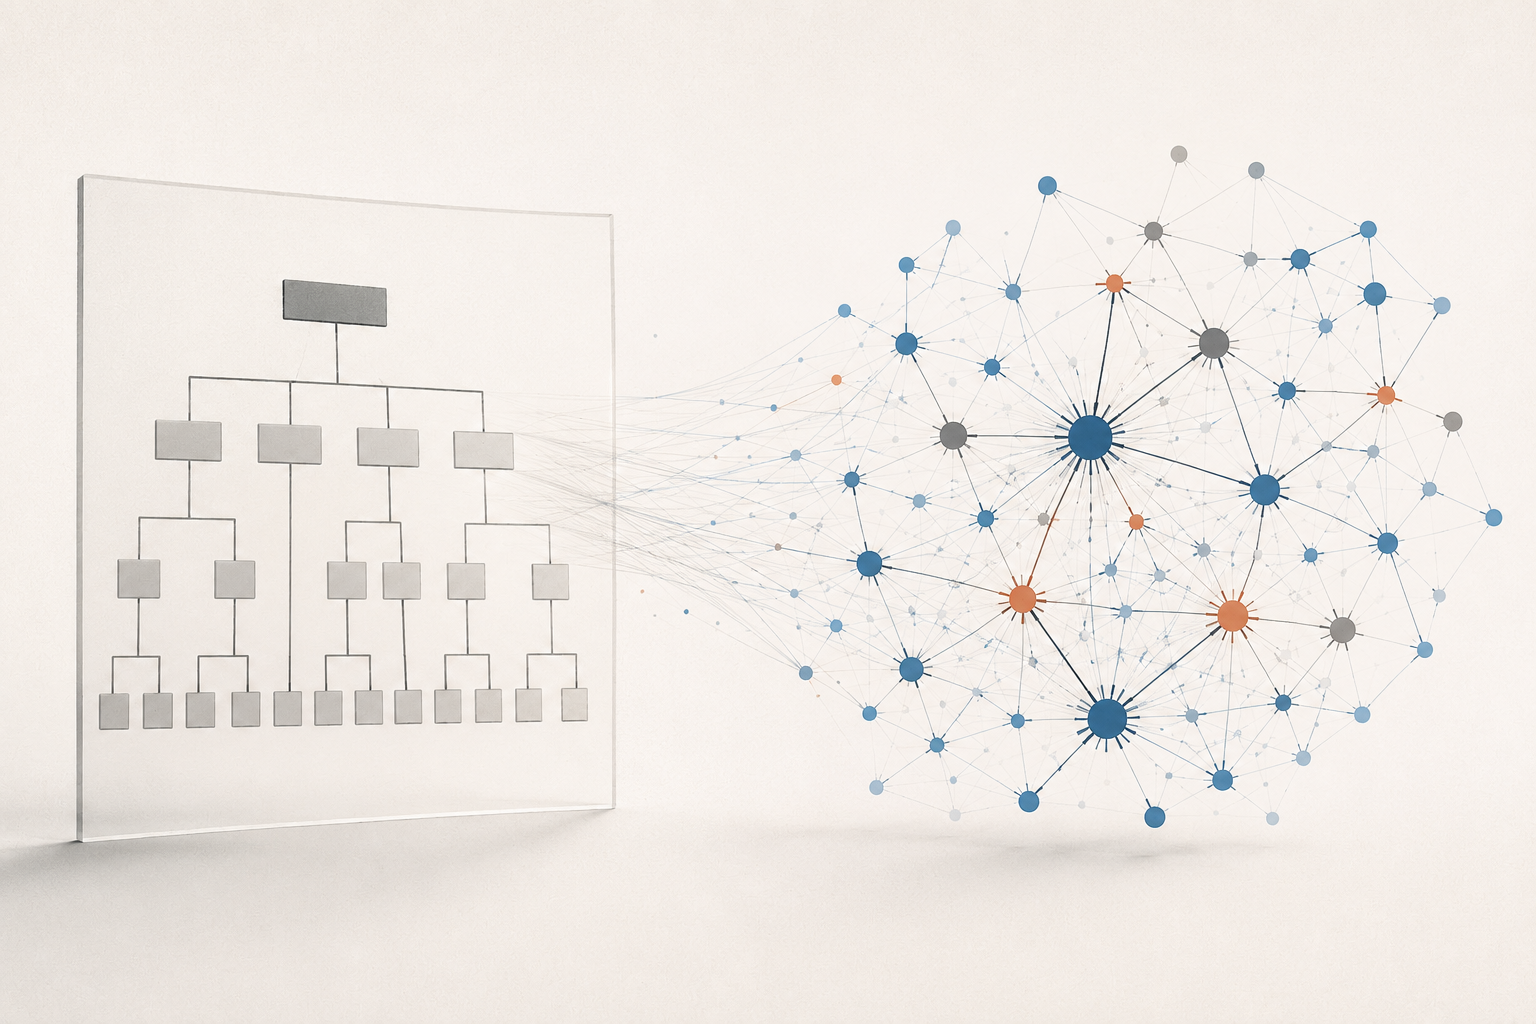
The org chart is an old idea. The earliest one dates back to the 19th century, when Daniel McCallum, a Scottish-born railroad engineer, drew an intricate tree to show the division of responsibilities across a railway system. IBM redesigned it in the 1950s into the version we still use today: boxes, reporting lines, one person per job, each team its own tidy unit. Every company since has some descendant of that diagram living in its HRIS. And despite decades of attempts at redesigns like flipping the hierarchy and flattening the layers, none of them show how work happens.
The informal, human network that powers your company is a black box. The org chart records the reporting structure, but reporting structure is a thin slice of how things get done. Think of the person three teams over who unblocks everyone, or the senior engineer whose code review is the gate on every release. The decisions, information, and momentum of the company run through people like them, yet the org chart understates their value.
This is old news to anyone who has studied organizations. In 1938, Chester Barnard, an American business executive, wrote that every formal organization carries an informal one inside it, and that the informal one is where the real communication happens. Learning a new job, he said, is mostly learning the “who’s who, what’s what, why’s why” of that informal society. Software people know a version of this as Conway’s Law: Melvin Conway observed in 1968 that any organization designing a system will produce a design that copies its own communication structure. You ship your org chart, or rather, you ship the way your teams talk to each other, which is often not what the chart says.
So the chart has always been a lie. What’s changed is that the gap between the chart and reality is now wider, and for the first time, measurable.
What the network looks like
Organizational network analysis, or ONA, is the practice of measuring and mapping how people really work together: the patterns of collaboration, communication, and information flow inside a company. Instead of boxes and reporting lines, you have a graph where every person is a node, and every working relationship an edge with a weight on it. The weight comes from real work signals, like the frequency and intensity of interaction, while who meets with whom determines which nodes are connected by an edge. Build this ONA graph across everyone at your company and a picture very different from the org chart appears.
A few things show up in that network graph that will never be visible in an org chart:
Some people are hubs. They’re connected to far more well-connected people than their title suggests. The measure of this is eigenvector centrality, close to what PageRank does for web pages: you’re influential if you’re connected to other influential people.
Some people are brokers. They sit on the path between groups that otherwise wouldn’t talk, which network theory calls betweenness centrality. When a broker leaves, two parts of the organization often unknowingly lose touch. A related idea comes from Ronald Burt, who spent a career showing that people who bridge structural holes, the gaps between otherwise-disconnected parts of the network, get better access to information and more control over how it moves.
And some people are peripheral players, out at the edge, connected to only a handful of others. Sometimes that’s the nature of the job. However, sometimes it’s an important signal worth paying attention to.
Rob Cross has been doing serious ONA work inside companies since the early 2000s, and his research revealed a finding every HR leader should know: in a typical organization, 3–5% of people account for 20–35% of the valuable collaboration. A tiny group holds the place together, and it’s often not the group at the top of the chart.
Why this matters more in the age of AI
You could have made most of these observations twenty years ago. What’s different now is that due to AI, companies are redesigning themselves faster and more ambitiously than at any other point in modern corporate history. Each of those redesigns is a bet on the network, and almost everyone is flying blind.
Organizations are getting flatter. MIT Sloan’s research on companies deploying agentic AI at scale shows spans of control expanding from the historical norm of ~7 direct reports to as high as 15 in some divisions. The most ambitious version so far is Bayer, which collapsed a dozen management layers into six, replaced annual budgets with 90-day resource cycles, and now runs spans of 14 and climbing. But network theory carries a warning to orgs flattening: middle managers are disproportionately the org’s brokers, connecting parts of the company nobody assigned them to connect. Some of that brokering is coordination overhead AI can absorb. Some of it is the connective tissue holding the graph together, and from the chart alone the two are indistinguishable. However, the network graph can tell them apart and highlight which connections are indispensable.
First-time managers are getting bigger jobs, earlier. Fast-growing companies are handing new managers spans and scope that used to take a decade to earn. With AI absorbing the reporting and coordination, the job shifts toward what humans are uniquely good at: coaching, judgment, relationships. But a veteran manager carries years of accumulated knowledge about whose work is stuck, who’s carrying the team, where escalation paths run. A first-time manager with 15 directs has to build that map from zero, fast. ONA hands them a head start, making visible where their team’s work routes, who the key connectors are, and what relationships to invest more time into. For the leaders above them, it’s a coaching signal that arrives months before an engagement survey: you can watch a new manager become their team’s hub, or spot the team routing around them and make adjustments while it’s still an easy fix.
Junior talent carries more weight per hire. Gen Z is entering the workforce at a strange moment, when AI is eating the bottom rung of the ladder. Junior people are now often starting their careers doing judgment work like reviewing AI outputs and owning project decisions end-to-end, years earlier than any cohort before them. The catch is that junior employees historically learned the informal organization the way Barnard described: by proximity, absorbing the who’s-who from the person two desks over. With smaller cohorts, distributed teams, and AI answering the questions they used to ask a colleague, that ambient assimilation has to be supported deliberately. Cross’s research says top performers are made by the internal networks they build, and the fastest movers build them in 9–12 months. ONA lets you watch a new hire’s network forming week over week, notice when it stalls, and intervene with an introduction or a cross-functional project before a formal performance review even occurs.
AI mandates are rewiring how teams work together. Shopify made reflexive AI usage a baseline expectation, wrote it into performance reviews, and asked teams to prove AI can’t do the work before requesting headcount. Plenty of companies have followed suit. The question adoption dashboards can’t answer is what the shift does to collaboration. On some teams, AI adoption and the human network reinforce each other: people share prompts, review each other’s outputs, the network densifies. On others, adoption comes with teams turning inward. ONA enables you to tell the difference, find the teams where both are compounding, and spread what they’re doing.
Then there’s the new frontier. As AI agents take on work a person used to broker (triaging, summarizing, routing information), they become nodes in the graph themselves, accumulating centrality like anyone else. Before long the most leveraged teammate at your company may not be a person, and you’ll want to know which agents have become load-bearing so you can back them with human ownership, redundancy, and oversight, the same way you would for a load-bearing human.
What you can see
ONA answers four questions every leader is currently guessing at:
Who holds influence here? The person with the most real influence in your company often has a mid-level title. You want to find them before you accidentally reorg around them, or before a competitor finds them first. They’re frequently your best internal-mobility bets too: high centrality, but maybe on the wrong team.
Is this new hire ramping? A new hire isn’t ramped when they finish an onboarding checklist. They’re ramped when they’ve woven into the network, and now you can watch that happen or fail to happen. It matters most for remote and hybrid hires, where someone who never builds connections can look fine on paper for months before it shows up in performance.
Who’s about to leave? People drift toward the edge of the network before they resign, often long before anything shows up in a review. When someone who used to work across the whole company starts consolidating down to a few people, that’s your sign to intervene.
What’s the blast radius of this decision? Any decision about a highly connected person carries more risk than the same decision about someone at the periphery. Promoting them, moving them, or losing them ripples through everyone they touch. Know who those people are before you make a call.
These four questions are the version of ONA that existed twenty years ago, run as a consulting project: survey the org, hand-draw the graph, present findings with a six-month shelf life, repeat never. What AI changes now is that the graph becomes observable continuously, over time. Work collaboration leaves a complete metadata trail of calendar invites, Slack channels, code reviews, shared documents, call recordings, and more. The edges are already being written down as a byproduct of the work itself, no surveys required. ONA goes from a snapshot someone builds to continuous instrumentation, similar to the shift product teams made when they moved from quarterly user research to always-on analytics.
That shift unlocks a different class of question, because the most interesting things about a network live in how it changes over time. For example, a reorg’s stated purpose is almost always “these teams need to work together more closely,” and you can now watch whether the cross-team edges actually form in the first few weeks. You can see which widened-span managers are becoming their org’s hubs and who needs support before the strain multiplies. And before big decisions, you can rehearse them. When Microsoft studied their own 61,000 employees through the move to remote work, they found cross-group collaboration dropped by roughly 25%, but they only realized after the fact. The next structural shift, and AI guarantees there will be several, can be measured as it happens, if you have the right tools to do so.
ONA has spent two decades as a diagnostic. However, continuous, longitudinal, agent-inclusive network data turns it into something closer to an experimental science: intervene, measure, learn, adjust. Every company is about to redesign itself around AI. Redesigns are always about the people and the thousands of connections between them, and for the first time, we can see it.
Seeing your own ONA map
We built ONA into Windmill as one of the core layers of the context graph, the same underlying data that powers performance reviews, one-on-ones, and the rest of the platform. The reason is simple: you can’t reason well about people from a reporting structure alone, and until recently that was the only structured picture of an organization anyone had.
Now there’s a second picture. We’re opening it up so teams can look at their own network directly: who the connectors are, who’s holding things together, who’s drifting toward the edge, and how all of it moves as AI changes the way work flows through a company.
Stay in the loop
Get the latest updates, insights, and news from Windmill delivered to your inbox.